The Symbiotic Relationship of Course Analytics with Evidence-based Design
July 5, 2023

This article was written by Jing Qi, Ed.D., Faculty Learning Experience Design.
Evidence-based assessment design (ECD) provides a conceptual framework for identifying observable evidence that supports the measurement of unobservable constructs, defined as as knowledge, skills and attributes by Mislay and his colleagues in their 2004 article A Brief Introduction to Evidence-Centered Design. Course analytics is micro-level learning analytics that validates the assessment outcomes and elicit desirable behaviors via harnessing learning data.
In the original ECD framework formalized by Mislay and colleagues (2003), the initial phase is to define what to measure in terms of KSA (Knowledge, Skills and Attributes). Since the KSA cannot be observed directly, we need to come up with the measurable, which can constitute evidence about KSA variables. The next step is to identify tasks or situations that can elicit observable evidence about latent KSAs. In some cases, attributes are referred to as ‘psychological constructs.’ The noncognitive factors, such as engagement and perseverance, are often considered as strong predictors of academic outcomes.
Although the fundamental ideas of ECD framework remain solid, the current digital revolution has changed the content of each model within the framework, which introduced new possibilities of what evidence we are able to observe, what data we are able to track, how we are able to mine the data (EDM) and make inferences of it (LA).
Here is an example of demonstrating the conceptual linkages between observable evidence and inferences in the rapidly-evolved digital world.
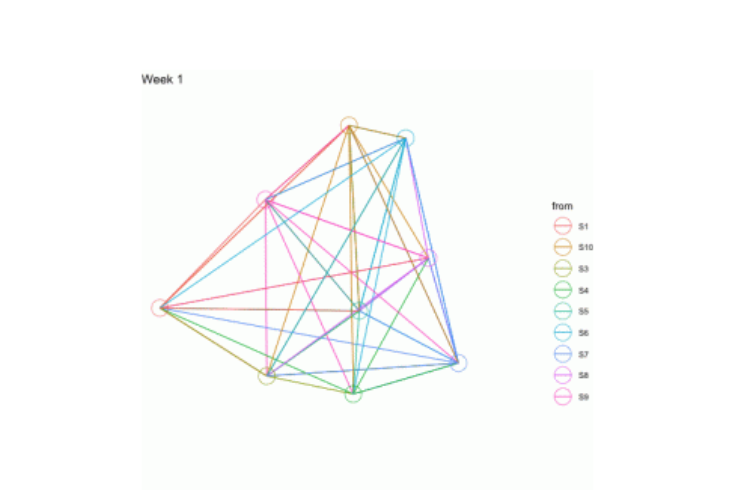
The data used was fabricated from group communications, which consists of directional weighted links that represent a direct message from one to another, message to the entire group and length of a reply. The tasks are composed of reflective writing and knowledge sharing. The task model elicits the evidence from individuals in response to given prompts about their understanding of topics. The technologies support us to harvest and harness the evidence, which otherwise, could not be fulfilled. Temporal networks are network representations that flow over time. In educational settings, they are useful for visualizing how a learning community develops or evolves through time. The time indices are an ordered sequence. This ordering can reveal information about what is occurring in the network through time. Below is an animated temporal network diagram, I generated in R using the fabricated data, that shows the dynamic of interactions over several weeks. Each node represents an individual, the links denote sending a message from one to another or addressing to the entire group, the color corresponds to the sender.
For more information on the Learning Experience Design program or other online master’s degrees available at GPS, please visit our website.